Team Project (tP):
Week 9 [Fri, Oct 9th] - Tutorial
0 Demo v1.2
The tutor to confirm the following has been done.
Admin tP v1.2: Demo
- As we don't have in-class tutorials this semester, do the following in lieu of a live demo:
[one member] Run your app using the latest released versionv1.2(orv1.2b, if applicable). Take screenshots of each available feature in action. Add those screenshots to your collaborative project notes document with an appropriate heading e.g.,v1.2 features demo. Alternatively, you can screen-record a demo, upload it to somewhere, and post the link in the project notes document.
1 Demo measuring code coverage
- Measure test coverage in your own IDE. Take a screenshot showing test coverage details such as lines covered, lines not covered, percentage of coverage for different files etc.
Textbook Testing → Test Coverage
Can explain test coverage
Test coverage is a metric used to measure the extent to which testing exercises the code i.e., how much of the code is 'covered' by the tests.
Here are some examples of different coverage criteria:
- Function/method coverage : based on functions executed e.g., testing executed 90 out of 100 functions.
- Statement coverage : based on the number of lines of code executed e.g., testing executed 23k out of 25k LOC.
- Decision/branch coverage : based on the decision points exercised e.g., an
ifstatement evaluated to bothtrueandfalsewith separate test cases during testing is considered 'covered'. - Condition coverage : based on the boolean sub-expressions, each evaluated to both true and false with different test cases. Condition coverage is not the same as the decision coverage.
if(x > 2 && x < 44) is considered one decision point but two conditions.
For 100% branch or decision coverage, two test cases are required:
(x > 2 && x < 44) == true: [e.g.x == 4](x > 2 && x < 44) == false: [e.g.x == 100]
For 100% condition coverage, three test cases are required:
(x > 2) == true,(x < 44) == true: [e.g.x == 4](x < 44) == false: [e.g.x == 100](x > 2) == false: [e.g.x == 0]
- Path coverage measures coverage in terms of possible paths through a given part of the code executed. 100% path coverage means all possible paths have been executed. A commonly used notation for path analysis is called the Control Flow Graph (CFG).
- Entry/exit coverage measures coverage in terms of possible calls to and exits from the operations in the SUT.
Exercises
Highest intensity coverage
Which of these gives us the highest intensity of testing?
(b)
Explanation: 100% path coverage implies all possible execution paths through the SUT have been tested. This is essentially ‘exhaustive testing’. While this is very hard to achieve for a non-trivial SUT, it technically gives us the highest intensity of testing. If all tests pass at 100% path coverage, the SUT code can be considered ‘bug free’. However, note that path coverage does not include paths that are missing from the code altogether because the programmer left them out by mistake.
Can explain how test coverage works
Measuring coverage is often done using coverage analysis tools. Most IDEs have inbuilt support for measuring test coverage, or at least have plugins that can measure test coverage.
Coverage analysis can be useful in improving the quality of testing e.g., if a set of test cases does not achieve 100% branch coverage, more test cases can be added to cover missed branches.
Measuring code coverage in Intellij IDEA
- Post a screenshot in the tutorial workspace document. An example is given below:
2 Exercise: OODMs
- before the tutorial Do the following question. As before, you should freehand-draw the diagram.
You can use the association class notation in the answer.
Textbook → OOP → Associations →
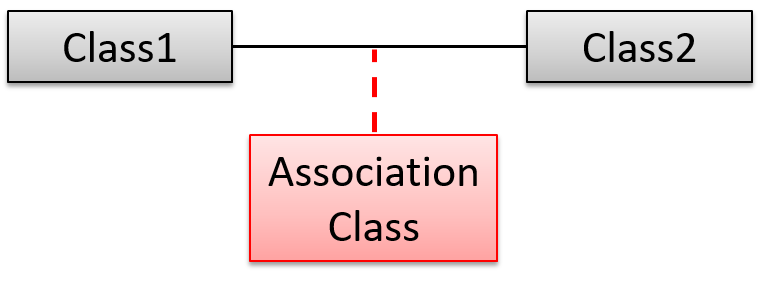
An association class represents additional information about an association. It is a normal class but plays a special role from a design point of view.
A Man class and a Woman class are linked with a ‘married to’ association and there is a need to store the date of marriage. However, that data is related to the association rather than specifically owned by either the Man object or the Woman object. In such situations, an additional association class can be introduced, e.g. a Marriage class, to store such information.
UML Class Diagrams → Association Classes → What UML/AssociationClasses
Implementing association classes
There is no special way to implement an association class. It can be implemented as a normal class that has variables to represent the endpoint of the association it represents.
In the code below, the Transaction class is an association class that represents a transaction between a Person who is the seller and another Person who is the buyer.
class Transaction {

    //all fields are compulsory
    Person seller;
    Person buyer;
    Date date;
    String receiptNumber;

    Transaction(Person seller, Person buyer, Date date, String receiptNumber) {
        //set fields
    }
}
Textbook → UML → Class diagrams →
Can interpret association classes in class diagrams
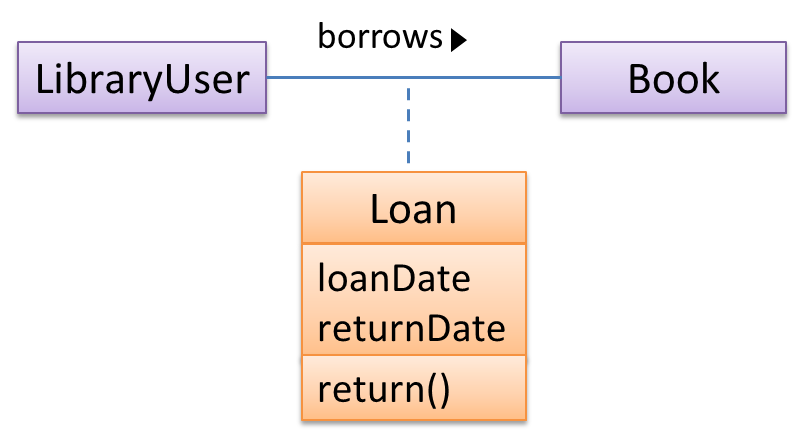
Association classes are denoted as a connection to an association link using a dashed line as shown below.
In this example Loan is an association class because it stores information about the borrows association between the User and the Book.
OODM for the Course domain
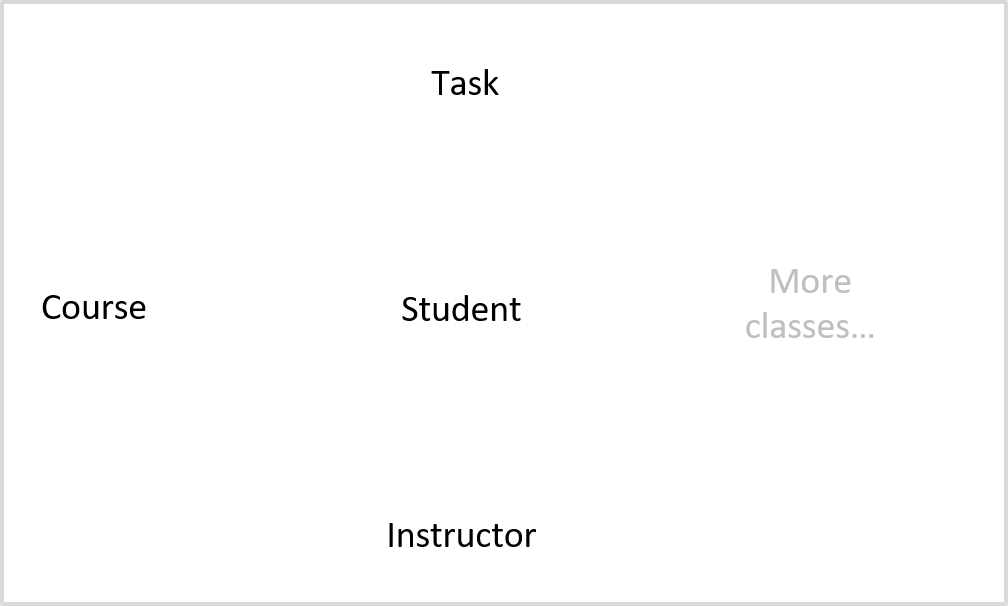
(i) Draw an OODM for the description below, about how in some universities, these are called modulescourses work in a certain university:
A course has a name and a code. A course is read by 10 or more students, and taught by a team of instructors one of whom is the coordinator. A course can have a number of tasks which can be assignments or tests. Some assignments are compulsory. When a student attempts a task, a grade and an optional feedback is given.
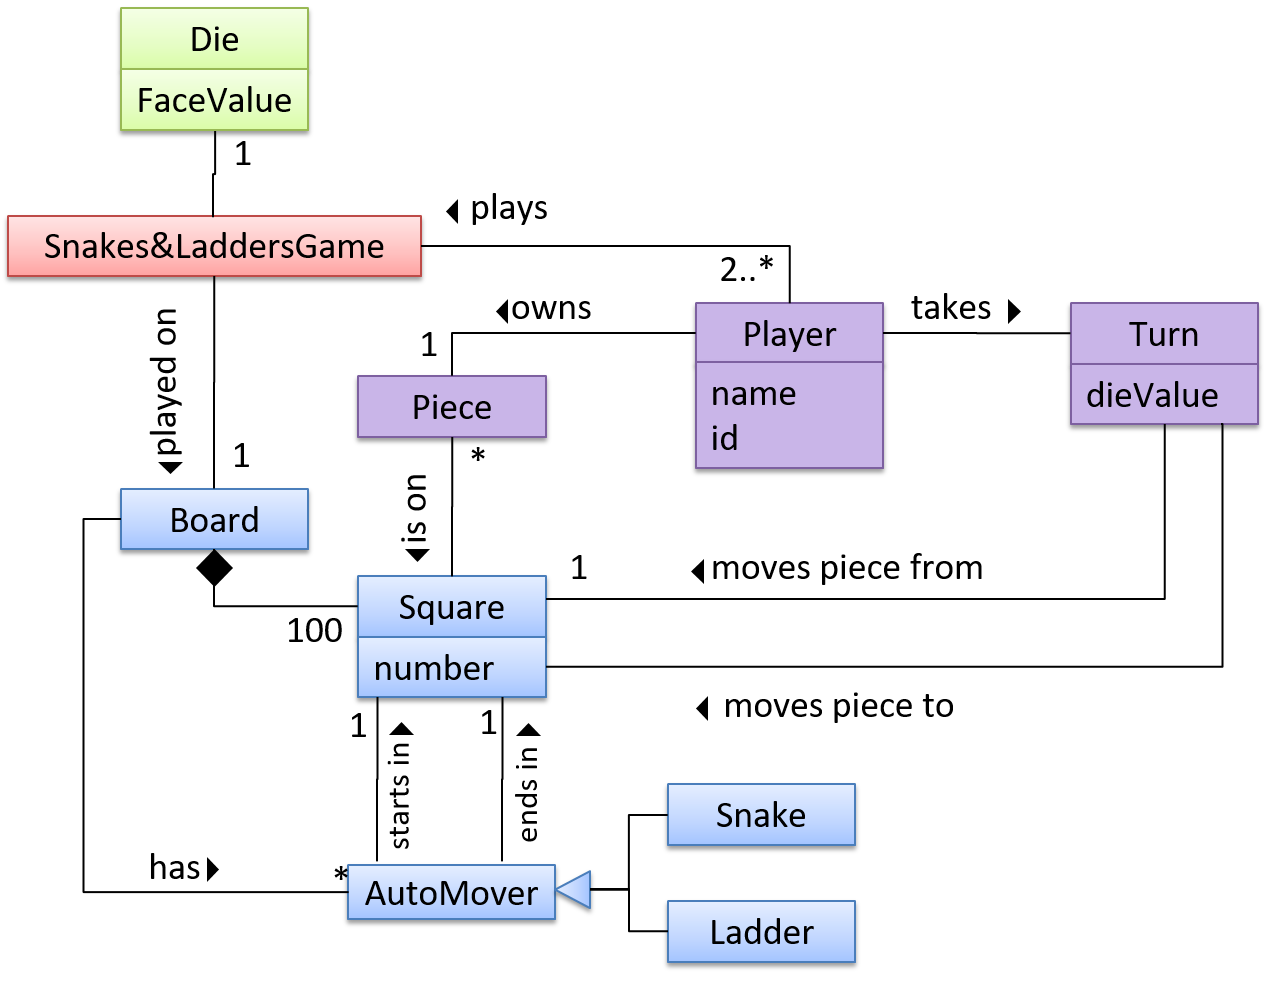
Example OODM
(ii) Which type of a UML diagram would you use to illustrate the following situation?
The course CS101 Intro to CS is taught by Prof Lee. It has two optional assignments and one test.
- during the tutorial
- Paste a screenshot/scan/photo of your answer in the online document.
- Discuss a sample answer, as guided by the tutor.
3 Exercise: Activity Diagrams
- before the tutorial Do the following question, similar to the previous question.
Model workflow of Burger shop
Draw an activity diagram to represent the following workflow a burger shop uses when processing an order by a customer.
- First, a cashier takes the order.
- Then, three workers start preparing the order at the same time; one prepares the drinks, one prepares the burgers, and one prepares the desserts.
- In the meantime, the customer pays for the order. If the customer has a voucher, she pays using the voucher; otherwise she pays using cash.
- After paying, the customer collects the food after all three parts of the order are ready.
Example Activity Diagram

- during the tutorial Post your answer and discuss, similar to the previous question.